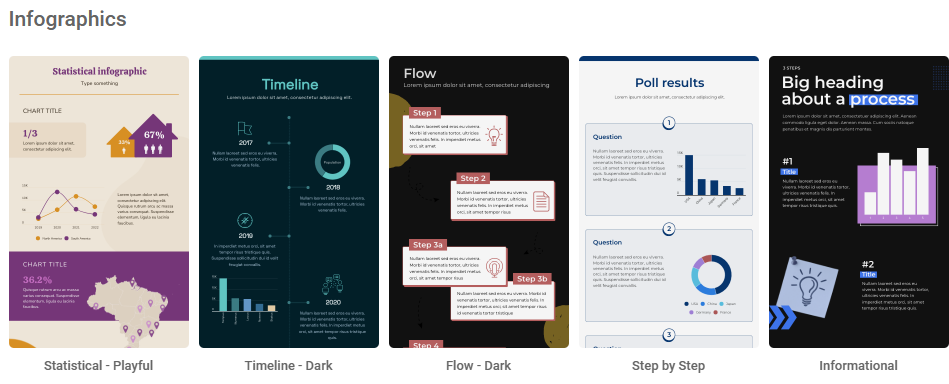
Infographics are no longer just for professionals as you can create infographics online free like an expert now, there is no need to be a graphics expert or have years of training as there are now lots of systems online that will do most of the work for you.
Infographics have become a must have for businesses and individuals alike as they are widely accepted as being much better at conveying information than many other forms of communication. They are simply a visual representation of information, processes, data, comparisons and instructions that combine text with images, icons and signs to simplify a message and make it easier to understand and remember. If you want to know more about why Infographics are better than plain text you can read my post here.
How to Create Infographics Free
While there are many online platforms that will do a lot of the work for you, to get the most out of them you do still need to do a bit of preparation if you want the best results. Before you even go looking for your Infographic maker you need to spend a few minutes working out the following:
- Who is your audience – it’s no use using a complex process diagram if you want children to pay attention to your message. If you are trying to communicate a strategy to your whole company then you need a really clear message that will focus on the key points.
- What do you want to achieve – Its an old cliche to start with the end in mind but it is really good advice. Think about what message you want to deliver, what do you want your audience to take away and remember.
- What format do you want to use – Do you want to educate, do you want to compare 2 things, do you want to present a process? There are 100’s of different styles of infographics and it will really help to have an idea of the sort that you want to use
Best Free Infographics Tools
There really is a lot of infographic tools available and while many of them seem similar there are a lot of differences, the ones below are the most popular ones that I can find that have an option to create infographics for free. I used the same search function in all the platforms to see how they compared.
Canva – This is definitely the most popular one and most people will have heard of it, it is really good for creating social media visuals as it has a lot of templates that are pre-formatted for Instagram or Facebook. It probably is the most all round design tool as it can be used for creating visuals for everything from websites to print products and even book covers which is really specific. I was really looking for a platform for creating Infographics and Canva is a really good option for this, the range is huge and you can create as many designs as you want with the free plan. I didn’t really like the AI tool in Canva but I think that might just be a personal preference as it worked fine
Piktochart – This is one of my favorites and I really like the AI generator tool, if you are really new to creating infographics then this is a great place to start. Simply type in what you want to create and hit enter, the AI generator will create up to 10 different Infographics for you to give you ideas, then pick the one you want and edit before using. I tried the AI tools on a few Infographic tools but I find that Piktochart just seems to be on my wavelength and always has an option that I like. The more specific you are about what you want the better the results but beware, you only get to create 5 infographics for free before you will need to upgrade to a paid plan. If you want to know more about Piktochart you can read my full Piktochart review here

Infogram – This is another really good option, it doesn’t seem to have as many different ideas for templates and I couldn’t find any AI support but Infogram does have some really useful templates. It has the standard posters, dashboards and process charts but also has a really good selection of social media specific templates and even some specific templates for email headers which I haven’t seen before. You can create 10 free infographics before having to get a paid plan and like many others you get a regular email with ideas. One of the best templates I saw came in an email and it was for a bar chart race which is a really cool animated infographic

Venngage – If you are looking for ideas for displaying statistics or reports then Venngage probably has the biggest selection in this area that I can find, some of the dashboard templates look fantastic and just need new data adding to make them bespoke. This is definitely an area where Venngage seems to have the edge on its competitors. They also have a really good range of Mind Map infographic templates and I haven’t seen a selection like this in many other platforms. The designs are also really clean and fresh which make it easy to focus on the key topics rather than being distracted by fancy designs that some of the other platforms have. It is really easy to use and has a fantastic support center with a whole range of video tutorials to learn from.

Visme – This is my new favorite Infographic tool so I also did a full review of Visme, I only really used it so I could see how it compared to the others but once I started I wished I had found it years ago. First of all the training is really comprehensive, you can even specify what level of skills you already have. I selected beginner to see what was available. You can even take certified courses through the platform to improve your recognized skill set. The range of Infographics is one of the biggest I have seen and what I really like were the integrated widgets for graphs and statistics. Some of the other platforms I have seen have donut graphs that you can adjust manually but the Visme graphs can all be adjusted by typing a value which is really easy and very useful. This is definitely one of the most comprehensive and easy to use platforms I have tested. Another one that only allows several free designs before you have to move to a paid plan.

How to Choose the Right Infographics Tool
This is really up to you and will be driven a lot by what you want to do and what sort of style you like, if you want to create a lot of content for social media then I would look at Canva or one of the others that seem to have pre-formatted social media templates like Infogram. If you want to create graphs and statistics infographics then I would definitely look at Venngage and Visme. If you want something really specific or want a lot more help then the AI generator tool that Visme have is fantastic even just for ideas. I would recommend trying the same idea in at least two different platforms and you will see that they all have slightly different styles, you can pick one that you feel is more your style as it will be much easier to work with. They are all pretty straight forward to use and they all have a huge selection so finding one that you click with is more important in my opinion. If you just want to create a couple of designs they are all suitable but if you want to create a lot of free Infographics then you will either need to use one that does not have a limit such as Canva or use a couple of different ones.
Steps to Make your Infographic
This is actually the easiest part but does require some input from you
Before you select the template:
- Think about your audience
- Decide what you want to achieve
- Think about the format you want to use
Once you have opened a platform
- Either use the AI options and specify what you want to do or select a template type and browse the selection of available templates
- Select the template you like and click it to open it / edit it / preview it depending on the platform
- Edit the design – all of the platforms allow you to edit text, change shapes, color schemes and fonts. You can add icons, mages, videos and even GIFs from large databases or your own library
- Enter your own information – All of the platforms allow you to add your own data and information to personalize it
- Proof read it to check you are happy and then you can export it. Most platforms allow you to download your creation, share it straight to the internet or save them in your own library online. Just make sure that you save it in a suitable format for whatever you plan to use it for
Conclusion
If you want to create your own Infographic but don’t want to spend anything but time or if you don’t have any experience in creating visuals, don’t worry, there are a lot of really good platforms available. The ones above are just some of the many that are out there and I will check more of them out in the coming weeks. They will definitely cover whatever you need to do and have everything from video tutorials to teach you how to create visuals to Artificial Intelligence tools that will create exactly what you ask for. The main thing is to put in a little bit of time before you go looking then it will make it much easier to decide which platform is best for you.
It is really easy now to create professional looking visuals without any experience or expense, if you have used any other platforms that you think are worth looking at please let me know in the comments below as i love to check out new systems and see what is out there.
Thanks for reading
Pete


Hey thank you for this post!
I have been on the lookout for ways to create and design free images for my site however currently unsure which one to select! Your post is amazing it contains great detail and doesn’t just explain the basics!
Going to implement what you have suggested.
Thanks again and have a great day!
Hi Sariya,
Thanks for your feedback, I really like using Infographics as I find them much better than plain text but I always used to struggle creating them, I find Piktochart is really good and particularly the AI generator as you can just type in what you want and it creates some really cool Infographics that you can just edit and save